AI data management tool: transforming bookstore operations.
Don’t waste time and money building something users don’t need. Let me validate, your idea and define a clear strategy backed by real user insight,so you know exactly what works before you start.
Running an online bookstore means dealing with data everywhere: inventory records, product descriptions, sales dashboards, and customer details. But keeping this data consistent takes countless hours of manual work. CRMs and CMS platforms demand endless input, and dashboards often fall short of delivering real insights.
The goal was to design an AI data management tool for bookstore data: a system that could handle repetitive tasks like data entry and even generate descriptions and dashboards, making complex analytics accessible to non-technical staff.
There are always some stocks, which illusively scale lofty heights in a given time period. However, the good show doesn’t last for these overblown toxic stocks as their current price is not justified by their fundamental strength.
Toxic companies are usually characterized by huge debt loads and are vulnerable to external shocks. Accurately identifying such bloated stocks and getting rid of them at the right time can protect your portfolio.
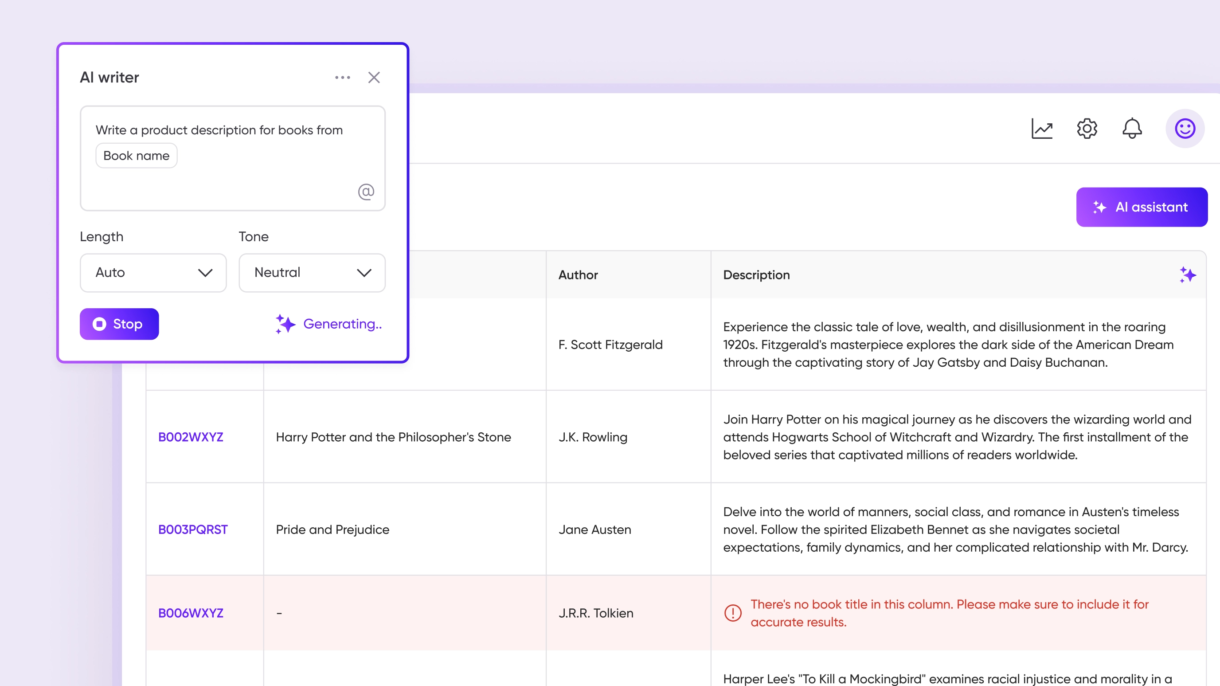
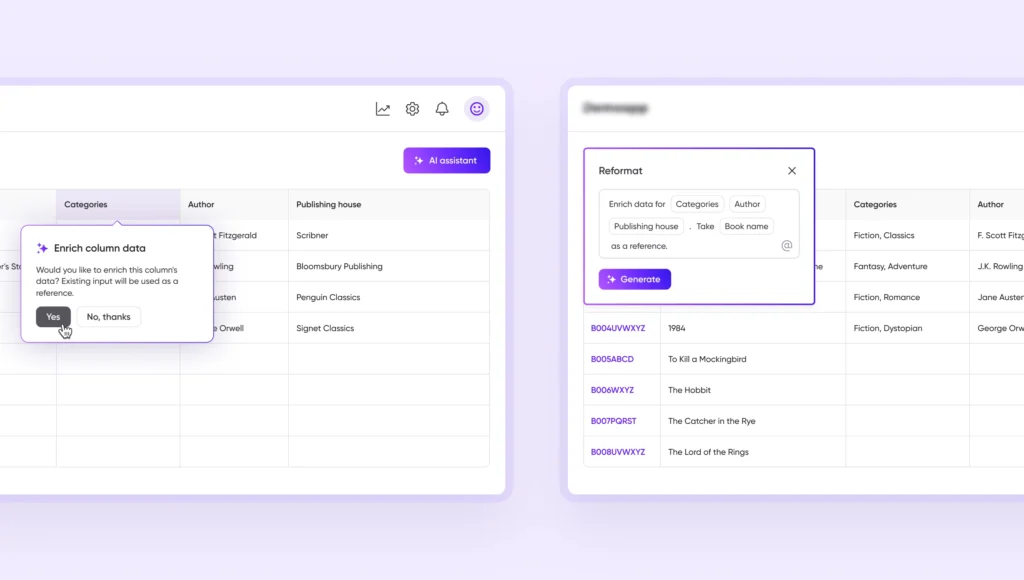
Description generation
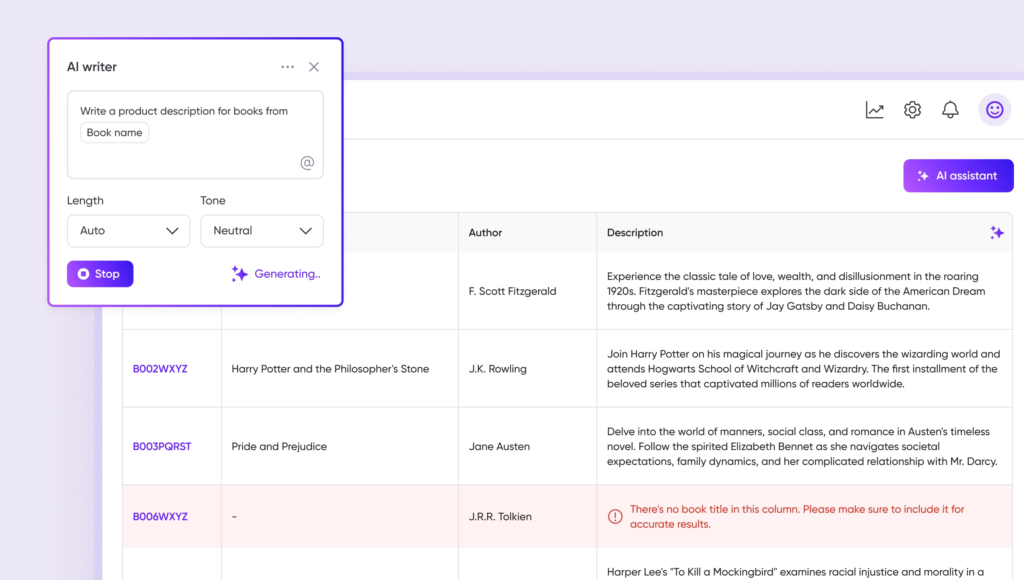
Writing product descriptions for hundreds of books is time-consuming and inconsistent. Tone varies, details get missed, and external tools are often needed. With conversational AI, users can now generate descriptions inside the system, without relying on external writing tools.
error prompts: if a key field (like book title) is missing, the system highlights it before generating.
inline AI writing: within the description column, users can select “Write for me” or create based on an example;
tone & length control: users can adjust messaging style to fit categories (e.g., professional, curious, emotional);
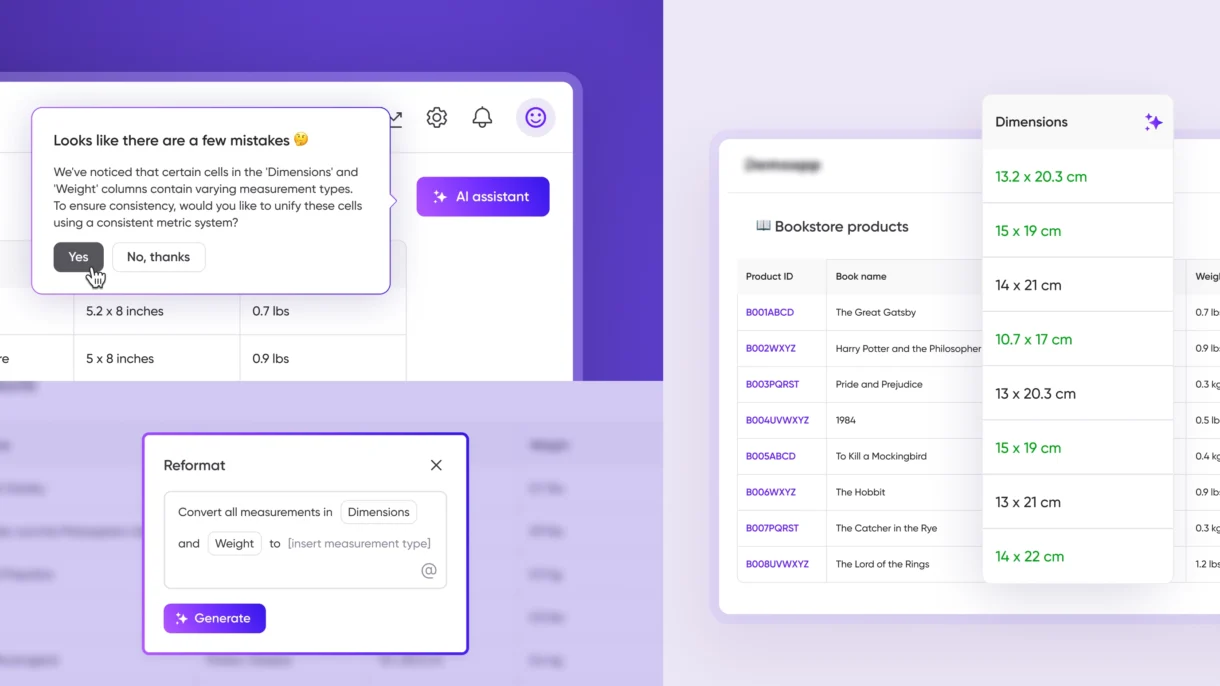
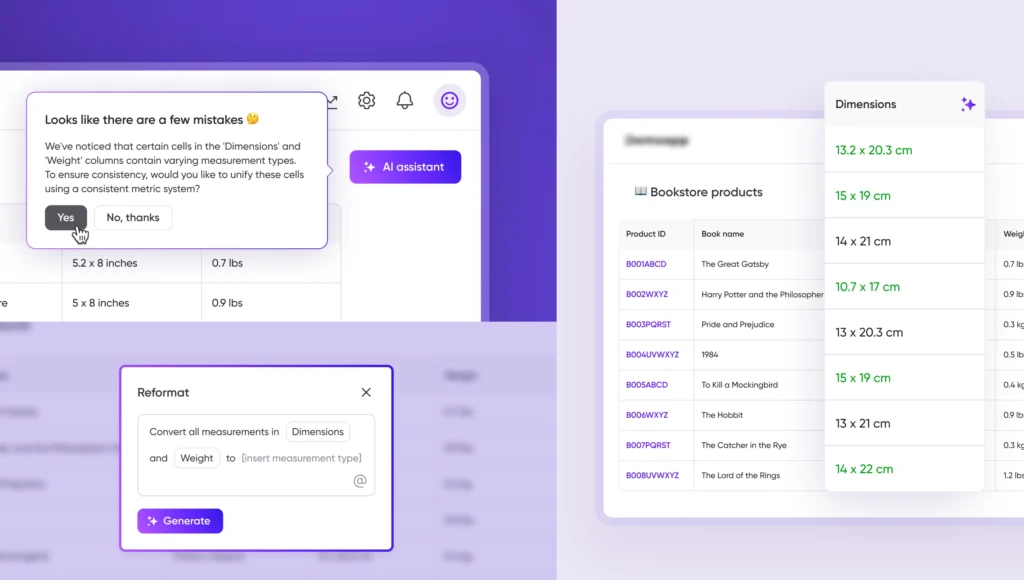
AI-assisted calculations
Working with complex formulas often excluded non-technical staff and left room for human error.
My solution: natural language calculations powered by AI. Instead of memorizing formulas, users simply describe what they need in plain words (e.g., “Calculate product performance index”), and the system generates the correct formula instantly:
inline integration: results are inserted into the relevant table column, so users can immediately see the output in context.
formula preview: the AI displays the generated formula and an explanation of how it works;
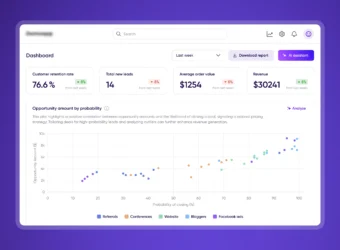
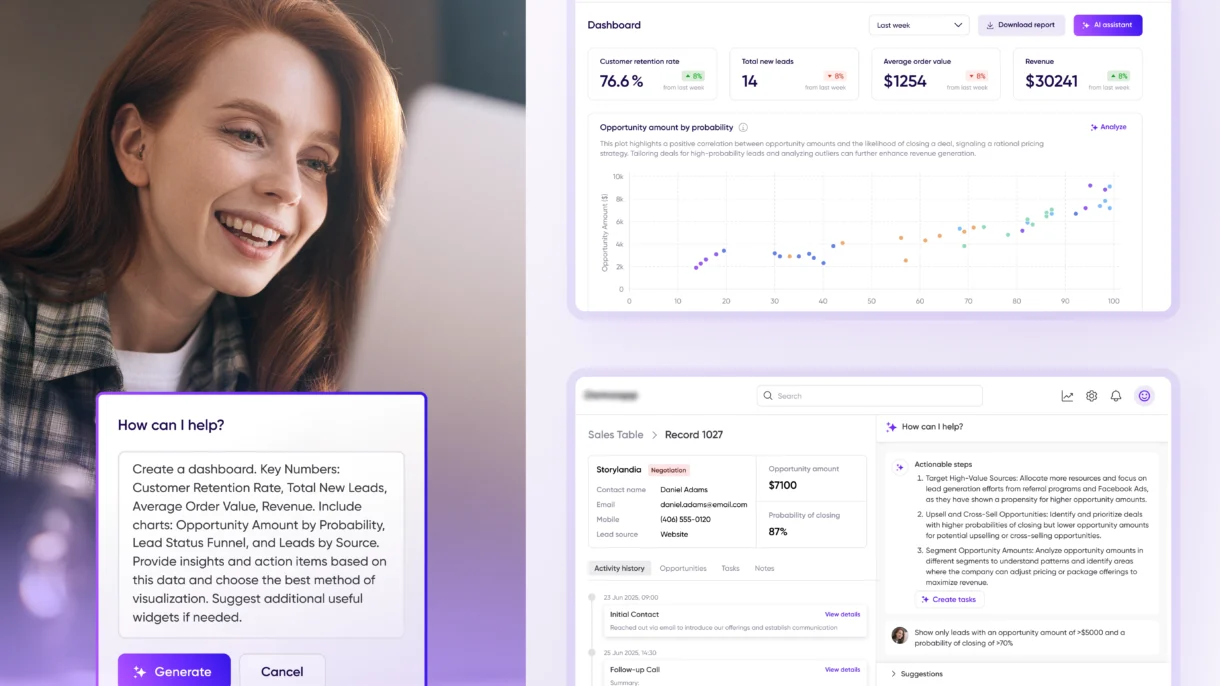
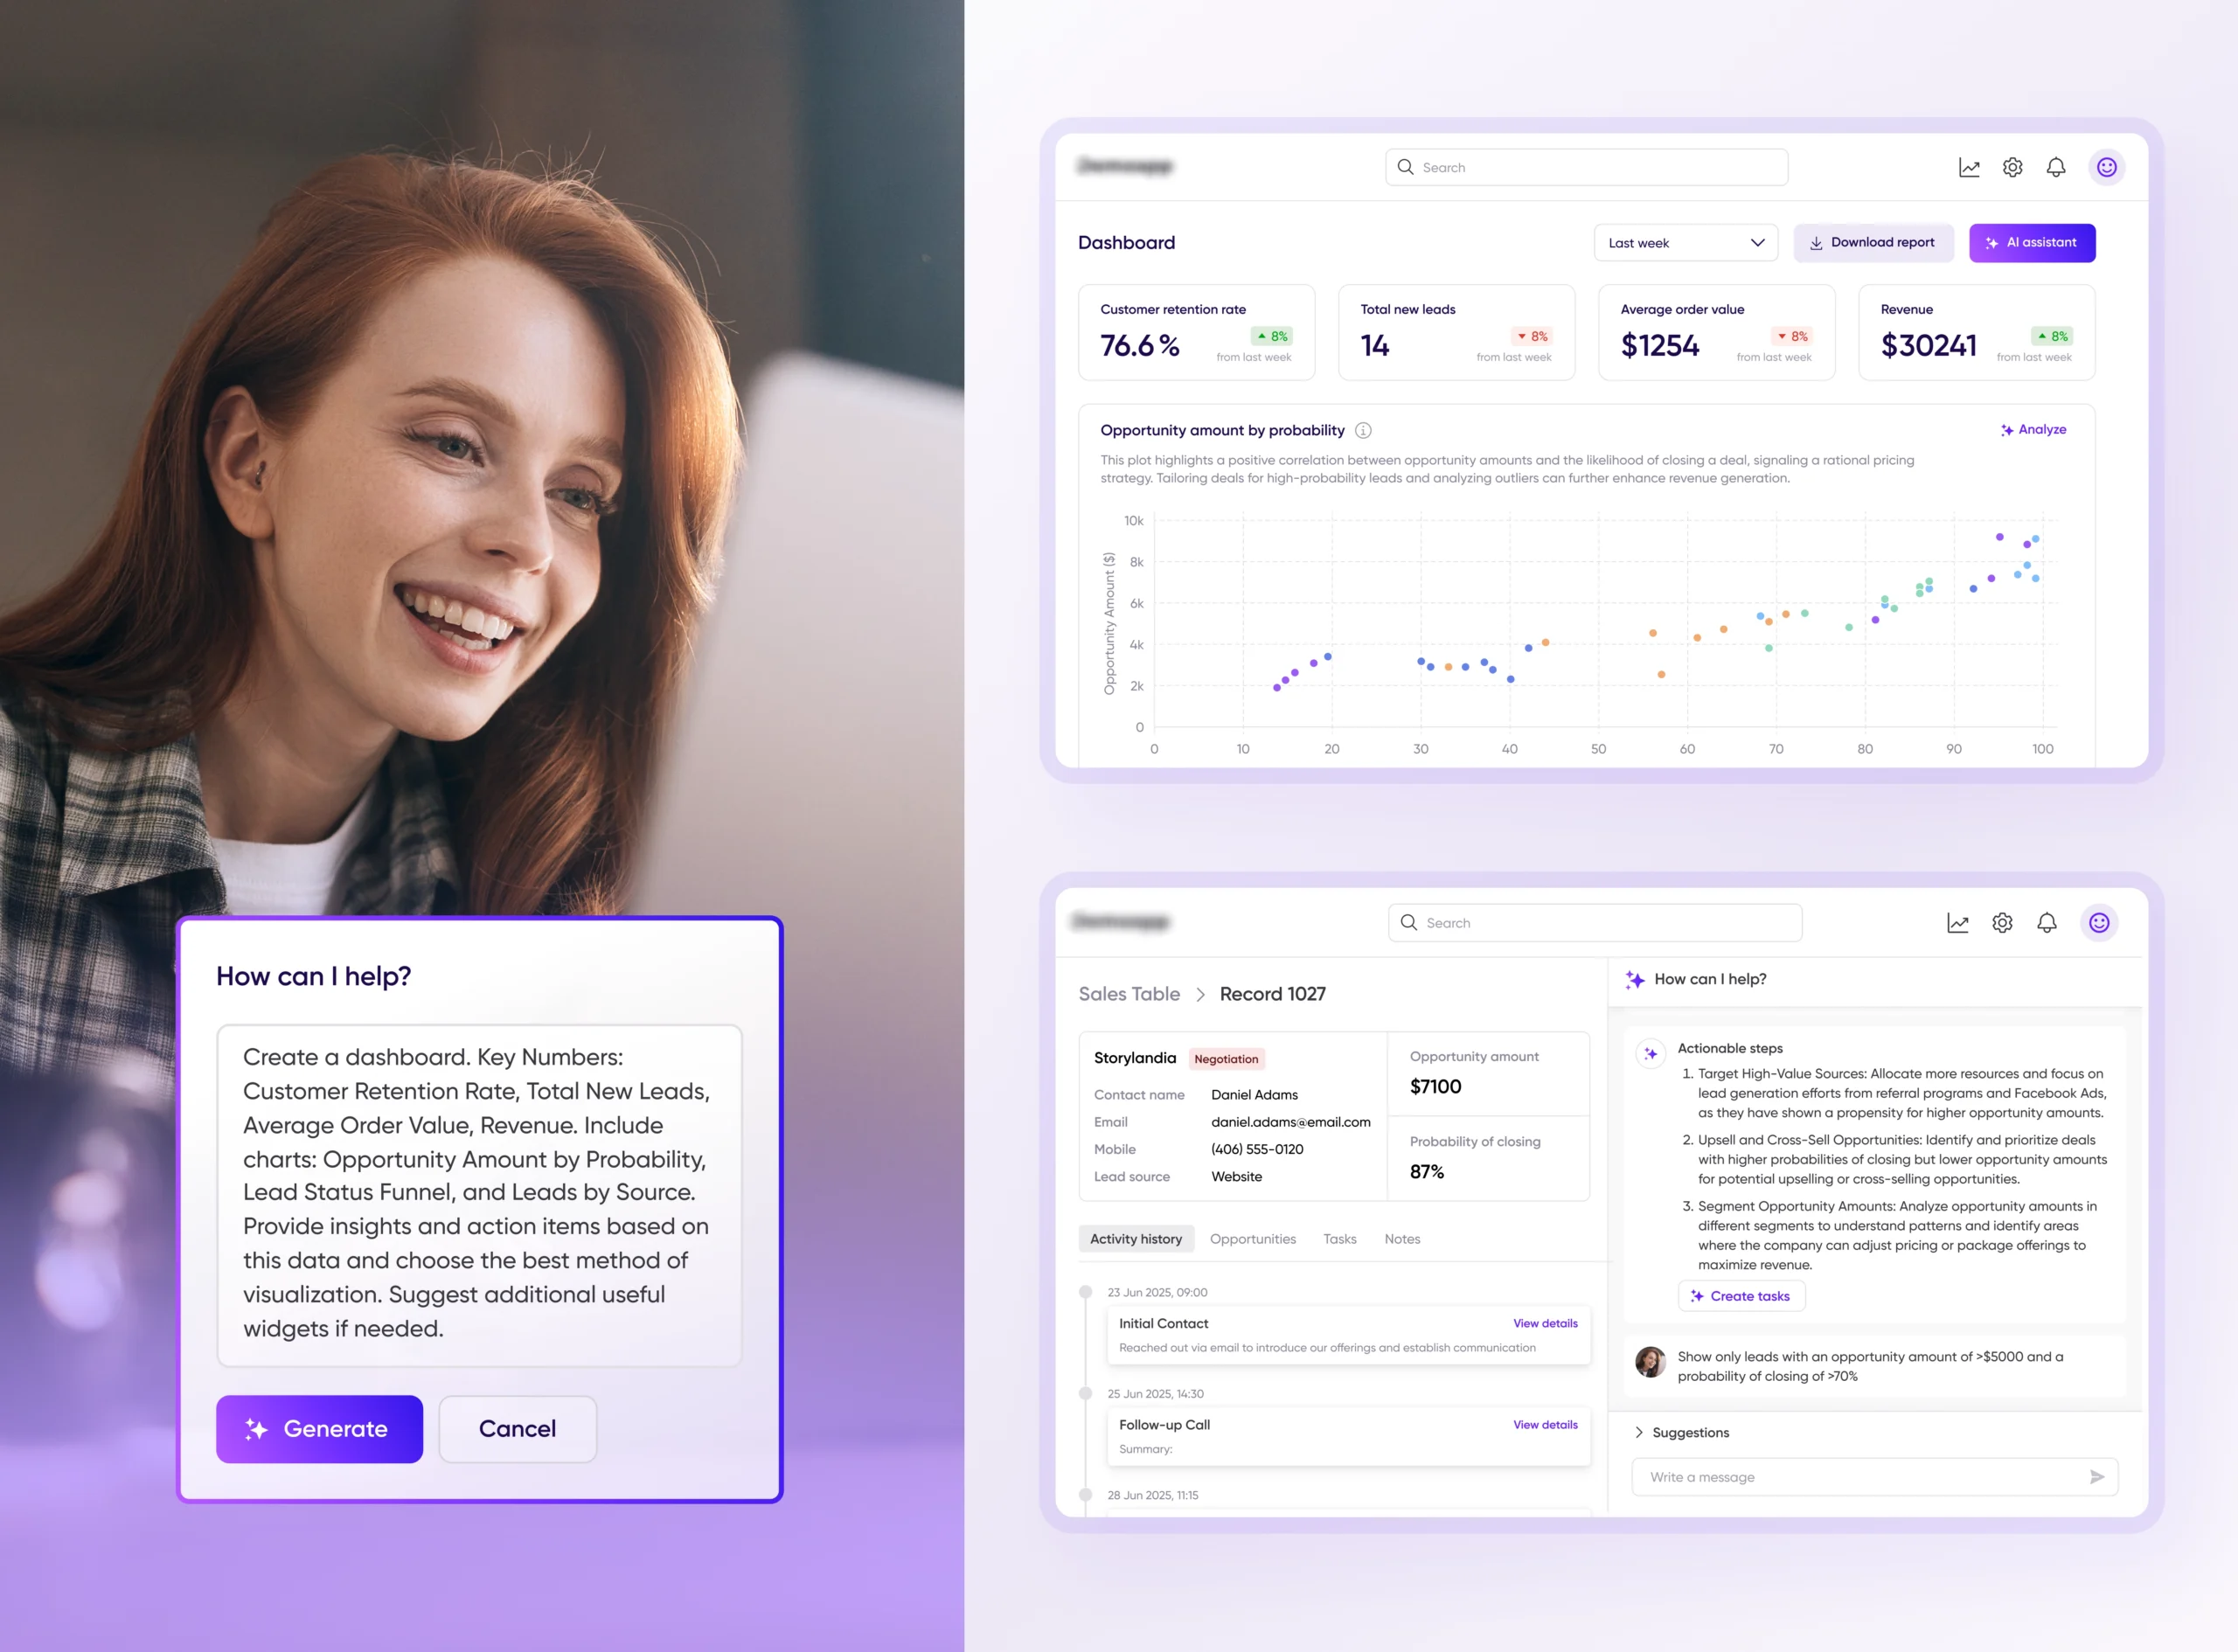
AI-driven dashboards
Dashboards are often either too complex for non-technical users or too shallow to provide real value. The challenge was to make visualization both conversational and actionable. This AI-driven dashboard builder turns plain requests into clear visualizations and explanations:
guided exploration: the assistant suggests follow-ups and generates new views.
natural prompts: users type instructions like “Create a dashboard with revenue, retention rate, and leads by source;”
smart layout generation: the system selects the most suitable chart types and assembles widgets automatically;
inline analysis: each chart comes with a short AI-generated explanation highlighting trends and correlations;
To conduct a discovery phase, create a viable business model, and design the full solution for MVP
Scope
Discovery phase and the UX/UI Design of the main flows for MVP, primarily Activities/Challenges, Rewards, and Store
Benefit
User research already conducted by the client. The client’s deep understanding of the product roadmap and MVP
Challenges
A very tight budget for a self-funded project. Little access to retailers that complicated understanding of their pains
Step 1
Discovery phase
Apart from the client’s enthusiasm, there was no certainty that the intended app will enable people to intensify their workouts on a lasting basis.
That is why this time the discovery phase was aimed to understand:
the real scope of the problem with physical inactivity in the U.S., to ascertain the market need for this product;
the proven benefits of walking that could motivate users for sure.
For this purpose, I initiated profound research and analyzed tons of popular and scientific data from TedX talks, academic articles, books, and reputable wellness blogs.
Screen OneScreen Two
Step 2
Wireframing
The wireframing stage usually aims to generate ideas and validate them fast, by creating an outline of the future UI/UX in broad strokes. But you may notice that my wireframes look very smart and quite capable to work for a clean-cut version.
I was interested to create neat and convenient layouts for a clickable prototype so that the user would enjoy working with it during the testing phase. As a result, I have received quick and high-quality feedback from the target audience, which was in turn used for making usability adjustments and improvements.
While short selling excels in bear markets, it typically loses money in bull markets.
So, just like identifying stocks with growth potential, pinpointing toxic stocks and offloading them at the right time is crucial to guard one’s portfolio from big losses or make profits by short selling them. Heska Corporation HSKA, Tandem Diabetes Care, Inc. TNDM, Credit Suisse Group CS,Zalando SE ZLNDY and Las Vegas Sands LVS are a few such toxic stocks.Screening Criteria
Step 3
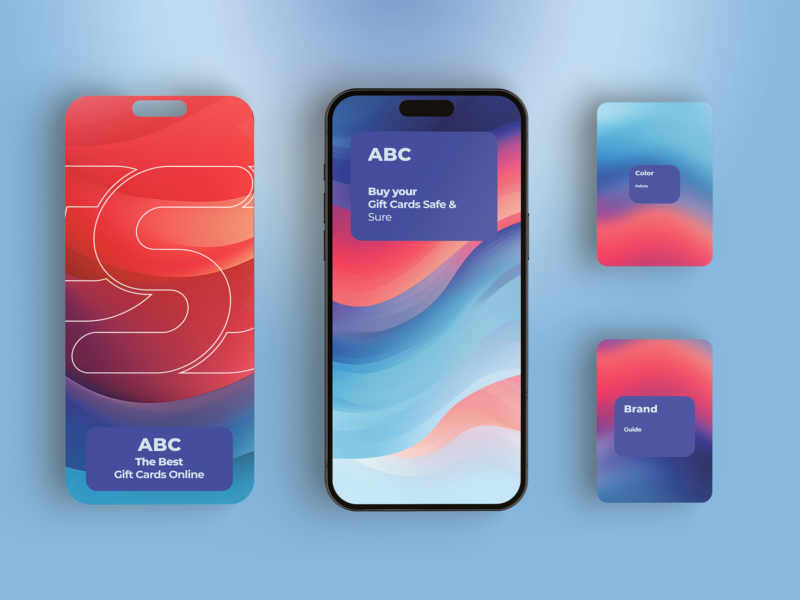
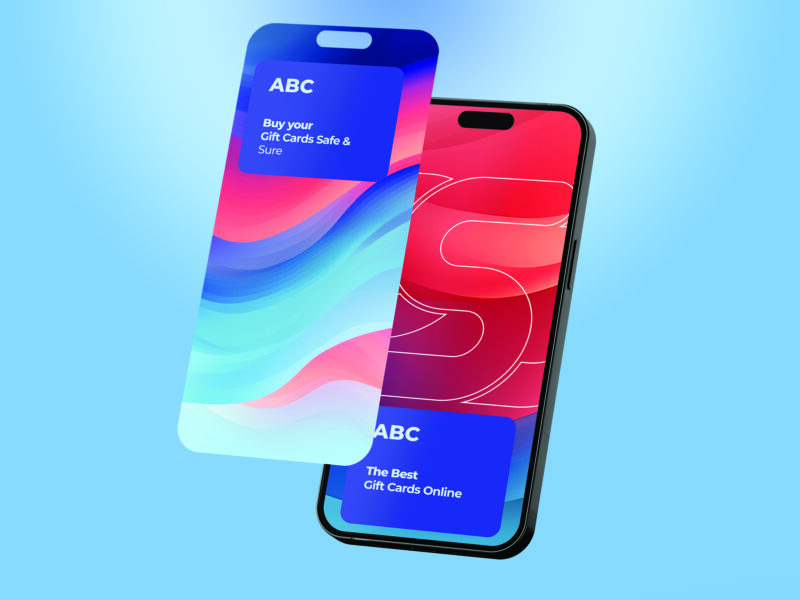
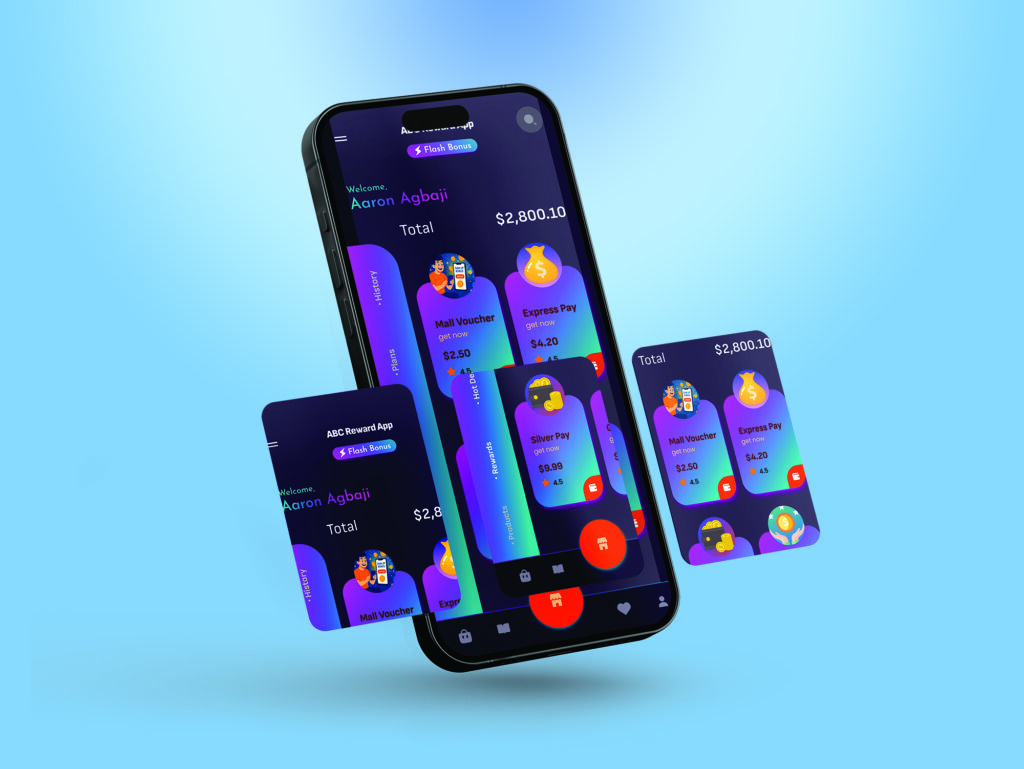
UI Design
After a few iterations, I came up with a UI concept that was elegant, minimalistic, and vibrant. Various groups of elements, such as physical activity challenges, grocery shops, discount reward items, geolocation, and others, were organized in a consistent, intuitively clear, and predictable way, all aligned with the brand identity guidelines.
The client highly appreciated the work done and approved the UI solution in one take. Hopefully, users will love it too. The key product features included Rewards, Shopping List, Challenges, and Create Walking Experience.